I want to share a quick overview of cracks and spreads which affect refinery economics, which in turn drive product tanker demand. Most of the charts shared below were made using Sparta Commodities, an excellent tool for tracking the minutiae of product markets in real time.
Let’s start with GASOIL.
The NWE 0.1 CIF Spread provides insight into regional price dynamics for low-sulfur gasoil in Northwest Europe. The spread’s steady decline from July to October suggested that gasoil markets in NWE were oversupplied.
From November onwards, there has been a sharp recovery, suggesting a tightening market. This is partly due to European refineries delaying the end of their turnarounds, leading to inventory draws.
This, in turn, is slowly opening arbitrage opportunities for importing gasoil into NWE. The recovery also aligns with robust winter heating demand in Europe, which typically drives up gasoil consumption.
GASOLINE.
The Trans-Atlantic arbitrage spread reflects the profitability of shipping gasoline from European refineries to the US. In tanker markets this route is known as TC2, MR product tankers carrying gasoline to, say, New York. A widening TA Arb typically signals increased freight demand for transatlantic shipments.
The arb spreads have collapsed, disincentivizing TC2 flows. European refineries’ prolonged turnaround season has also led to a lack of cargo “push”, which otherwise would have helped clean tanker demand in Northwest Europe. More recently, US gasoline inventories has risen, which will also dampen the “pull” on European cargoes.
EBOB Gasoline cracks measure the profitability of refining gasoline (specifically E10, a European gasoline blendstock) from crude oil.
The big November rally — with the spread climbing sharply to $9.15/bbl in December — indicates improved refinery economics. These higher crack spreads incentivize European refiners to maximize runs and export more gasoline.
Gasoline cracks in the Mediterranean have also improved dramatically:
JET FUEL
The Jet E/W spread has been consistently negative throughout 2H 2024, which has disproportionately hurt LR2 owners (such as STNG 0.00%↑ and TRMD 0.00%↑) because the economics have discouraged the shipping of jet fuel from the Middle East to NW Europe.
That said, the economics have been improving, and once this spread moves into positive territory — which appears to soon be likely — we could see this trend reverse:
As “East West” voyage now goes around Africa instead of through the Suez Canal (thanks, Houthis!), ton miles are longer. The leads to a positive feedback loop, where every TC20 voyage (Middle East to Europe on an LR2) rewards the owner with a long voyage and increases overall fleet utilization for everyone else.
Because these cargoes have not been moving East to West in recent months, this implies that diesel supply in Europe will remain tight in January, which will support European gasoil crack spreads and create more “pull” in the coming months.
FUEL OIL
The strong Rotterdam HSFO spread suggests tighter markets due to reduced local HSFO output and increased demand, including East of Suez. The spread was negative just 2 months ago, and this is yet another sign of strength in refinery margins across products that we are seeing in Europe recently.
GASOIL
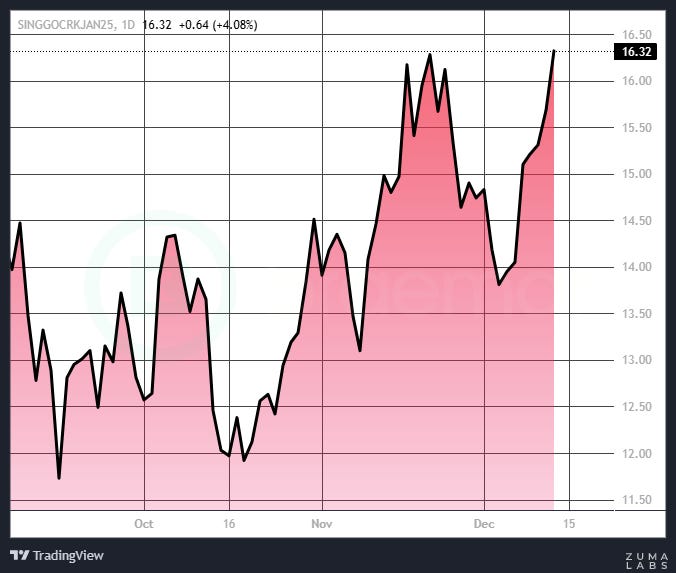
To finish, I want to share this chart of Gasoil crack futures in Singapore:
The rising Singapore gasoil crack spread is a consequence of tightening supply and robust regional diesel demand. This trend also indicates strong refinery economics in Asia, in part due to the fact that Chinese refinery utilization is quite low, around 70%, and down year over year, which in turn helps balance the glut of refining capacity East of Suez and improves margins for everyone else.


Thank you, Ed! Great educational stuff!
since mid Oct oil has been trading in a narrow range 70-75 usd brent. i understand oil trading rangebound makes cracks & spreads largely demand dependent (at least this is how i read these charts), which in this time of year usually trends up. i also assume when oil volatility is higher, there might be much more moving pieces (reasons for higher volatility etc etc). i wonder if in your research studies you have by chance encountered evidence or come to a conclusion what might be the optimum oil price range to simplify the forecast of cracks and spreads to usual s&d seasonal patterns. i remember euronav has mentioned in one of their reports from prior decade usd 60-80 price range is the perfect one, wonder if it's still valid.