10 Charts
Chart porn to celebrate US Independence Day.
Below are 10 notable charts from my inbox.
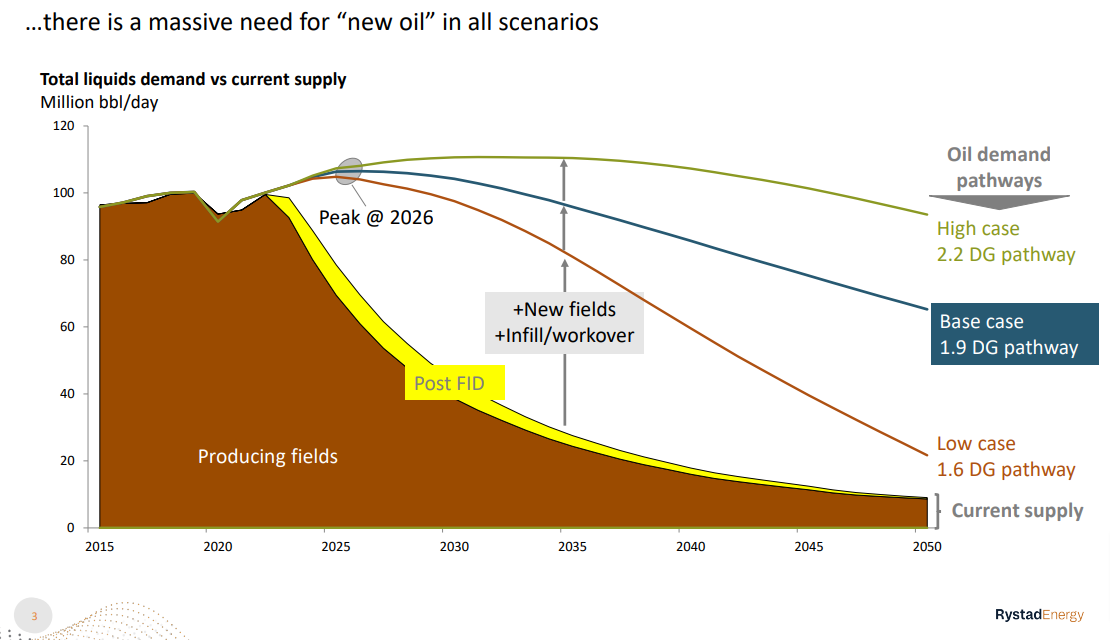
The case for offshore oil exploration, in one chart:
Crude oil tanker orderbook to fleet ratios, in historical context:
Supramax asset values versus 1 year TC, via Fearnley’s:
West African crude was expected to replace Russian crude post EU embargo, but in fact the Americas have been the big winner:
Have tanker S&P asset values peaked? via Clarkson’s:
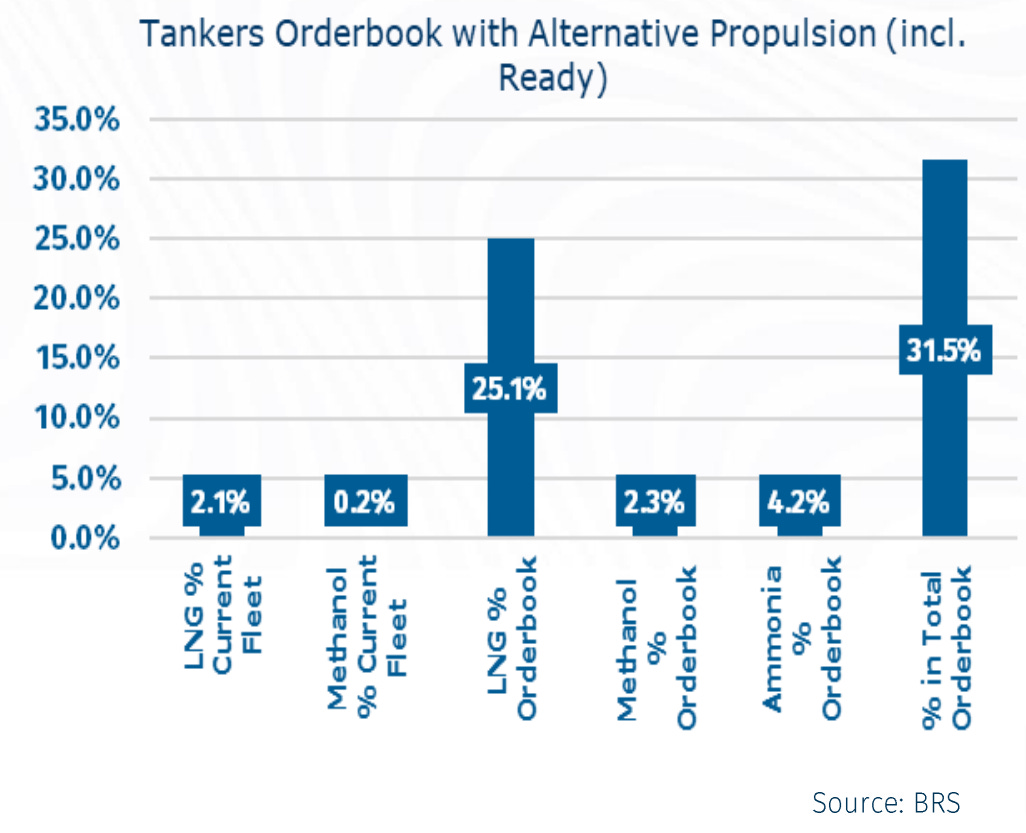
Most tanker owners are not prepared to order dual-fuel newbuilds, via BRS:
VLCC spot rates remain remarkably buoyant so far in Q3, via Arctic:
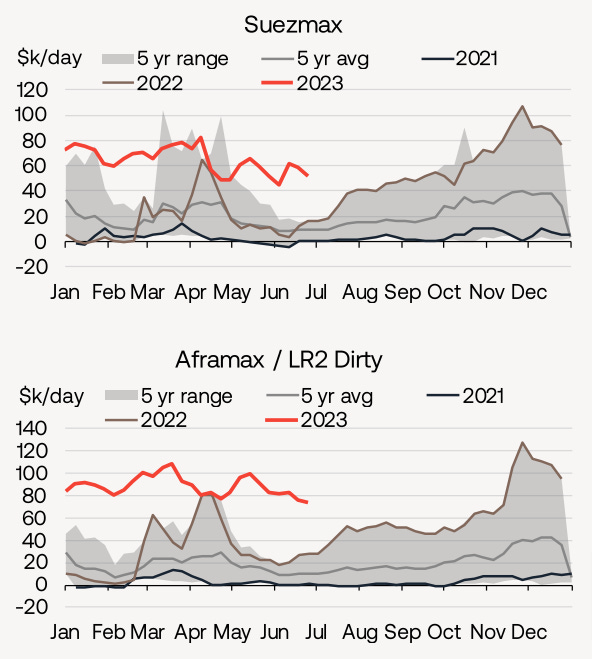
Still, it’s Suezmax and Aframax tankers which have benefitted the most from the “war premium” following the invasion of Ukraine, via Braemar:
We are trading near “average” valuation levels, even in an exceptional freight environment, via Stifel:
Scrubber premiums have come down. But with cheaper bunker costs ALL vessels are more profitable. via Clarkson’s:
[EDIT] One more chart just in from S&P Global, which I’ve added to illustrate that as the Russian premium disappears from freight, the Urals discount does too:
Happy Fourth of July. If this is helpful, I’ll do it more often.


high quality charts. Thanks!
Very interesting , particularly the off shore oil exploration one . Much appreciated , many thanks .